Friday, August 31, 2012

Using Longer Red Traffic Lights to Reduce Pollution

Intelligent Traffic Control in Copenhagen(Copenhagenize, Mar. 29, 2012)

What do you do if your proposal to implement congestion pricing to reduce both congestion and pollution is blocked by conservative political forces. If you are the mayor of Copenhagen, you use intelligent stoplights that, counter-intuitively, are used to increase the delays and congestion by increasing the red light times. This step is taken on days when pollution exceed certain levels and is designed to encourage drivers, warned in advance, to leave their cars at home. With the same population as Canada’s capital at 1.2 million, Copenhagen has almost twice the number of premature deaths due to air pollution (800/year), so that action to reduce vehicle emissions is needed. 7 million Kroner has been budgeted for the pilot project- about one
  Canadian dollar for each citizen of that city.
   

Key Quotes:

 “If the pollution levels are too high on any particular day, all the traffic lights on the main roads into the city will turn red and stay red longer than normal. The time the traffic lights are green will be reduced by 10 percent. Motorists will be informed by the internet or text messages before they leave for work so they can choose alternative transport forms”

"It will create queues on some of the approach roads, but it certainly our hope that people will think about it. The signal we want to send is that you have to use your car with careful consideration"

 "There are fewer people in the areas in question than there is in the densely populated areas. But the whole idea is to get people to leave the car at home”

 "As long as we can't use road pricing, we must use other ideas in order to lower emissions"
Enhanced by Zemanta

Wednesday, August 29, 2012

The Argument for Sprawl or Growth in Urban Planning

City Lights 
 Are compact cities a desirable planning goal?(14 page pdf, Gordon, Peter; Richardson, Harry W, American Planning Association. Journal of the American Planning Association, Winter 1997) 

Today we review a paper written more than a decade ago that presents arguments and some factual evidence in favour of sprawl (or “growth” as the authors term it) and against the trend toward more and more concentrated populations in the urban area. This is an important debate because of the economic and environmental issues involved. Readers of this post are invited to examine some of the measures presented in the paper as general indicators, as they apply to individual cities to see if they apply there. 

Key Quotes: 

“many planners advocate “compact cities” as an ideal in contrast to increasingly spread-out metropolitan development” “more subsidies are given to auto travel
  • Federal, state and local expenditures for highways were $66.5 B in 1991; revenues were $53.8 B
  • Federal state and local expenditures for transit were $ 20.8B
  • on a per-passenger-mile basis the auto subsidy [in the USA] is .54 cents, the transit subsidy is 29.2 cents (54 times as large)
  • air pollution costs per mile [in southern California] were 3 3.6 cents and congestion costs were 7.5 cents..and up to an additional 11 cents per passenger mile of parking subsidies…the full auto subsidy adds up to 22 cents per passenger mile..falls short of the transit subsidy"
“the spreading out of cities reduces markets for conventional public transit (especially fixed rail) which is spatially inflexible and usually oriented to downtown.. despite more than 25 years of federal assistance, mass transit carries only about 5 percent o people who commute to work. The other 95percent mostly use automobiles”

“suburbanization has been the dominant and successful mechanism for reducing congestion. It has shifted road and highway demand to less congested routes and away from core areas”

“Rapid advances in telecommunications are now accelerating the decentralization trends set in motion by the advent of the automobile. In 1890, the “:effective radius” of US cities was said to be 2 about miles, based largely on pedestrian access… this has grown to 8 miles by 1920 to 11 miles by 1950 and to 20-24 miles by the 1970s”
Enhanced by Zemanta

Monday, August 27, 2012

Pros and Cons for Road Pricing in Canada

A simulated-colour image of Greater Toronto Ar... 
A simulated-colour image of Greater Toronto Area taken by NASA's Landsat 7 satellite from 2004. (Photo credit: Wikipedia)

 Congestion Relief: Assessing the Case for Road Tolls in Canada (36 page pdf, Robin Lindsey, C.D. Howe Institute Commentary, May 2007) 

A look at arguments for and against road tolls is reviewed today, noting that in the 19th century, public and private toll bridges, roads, and ferries were prevalent in Canada. As the paper concludes after making several key recommendations, “that toll roads will be resurrected in the twenty-first century and seem like an obvious innovation whose time should have come (again) long ago”  

Key Quotes: 

“road transport infrastructure is aging. Existing funding mechanisms such as the fuel tax are unlikely to yield enough revenues to pay for future maintenance, rehabilitation, and new construction — at least without large and politically unpopular increases in tax rates” 

 “By raising the costs of driving, … road pricing sets off a virtuous circle of effects for public transit systems that share the right of way with cars. Transit vehicles speed up when tolls are imposed, because there are fewer cars on the road. This attracts more travelers to transit. In response, transit operators improve service by adding routes and increasing frequency” 

“[in Holland]..fewer than 10 percent of respondents said that spending toll revenues on new roads or to reduce driving costs was “unacceptable” or “very unacceptable”, while spending on the general budget was opposed by nearly 75 percent of respondents” 

“[in Germany]people become more favourable toward road pricing if it seems inevitable, which suggests that holding a referendum after a trial than before is most likely to improve the prospects of a yes vote” 

“A recent poll of Canadians that asked “How should new greenhouse-gas reduction programs be funded?“ found greater support for tolls (37 percent) than for an increase in the price of gasoline (20 percent) or in income taxes (18 percent)” 

Excerpts from key conclusions:
  • "Congestion is a serious and growing problem .. Canada’s nine largest urban areas, by one estimate, face annual costs of $3 billion… the loss from congestion and shipment delays in the Greater Toronto Area (GTA) is some C$2 billion annually.. In per capita terms, the annual cost ranges from C$17 for Hamilton to C$270 for Toronto
  • Estimates of the annual costs for Europe include US$38 billion for the United Kingdom and US$800 million to $1 billion for Stockholm in lost time, traffic accidents and deaths, and worsened environmental conditions.. In per capita terms, these costs are roughly US$210 (for the United States), US$630 (for the United Kingdom), and US$670 (for the Stockholm urban area).
  • Neither fuel taxes nor parking fees are effective in dealing with traffic congestion..Road-pricing’s usefulness in charging for road damage, insurance, and so on are a bonus.
  • Net revenues from road charges.. can pay for road construction and maintenance, to support other modes of transport, or to reduce other distorting taxes; they can also enhance the public’s acceptance of road pricing by compensating potential losers.
  • Claims that road pricing hurts the poor are exaggerated. Poorer would benefit if road-pricing revenues were used to enhance public transport service. Also, policymakers may choose to address equity concerns by offering discounts or exemptions”
Enhanced by Zemanta

Friday, August 24, 2012

Estimating UK Deaths due to Local Particulate Air Pollution

Statement on Estimating the Mortality Burden of Particulate Air Pollution at the Local Level (13 page pdf, Committee on the Medical Effects of Air Pollutants (COMEAP), Aug. 2, 2012) 

Also discussed here: Mortality burden of particulate air pollution And here: The Mortality Effects of Long-Term Exposure to Particulate Air Pollution in the United Kingdom (108 page pdf, Committee on the Medical Effects of Air Pollutants (COMEAP), 2010) (Press Release, Committee on the Medical Effects of Air Pollutants (COMEAP), Aug. 2, 2012) 

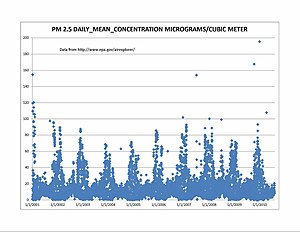
Today we review a statement from COMEAP calling for estimate of deaths attributable to air pollution at the local level across the UK. The statement assesses and analyses methods and uncertainties associated with this approach. Roadside emission sources were not included but only long term exposure to particulate pollution. Separating anthropogenic from natural sources of particulates is another uncertainty which must be
 considered in the estimate of the health burden
.English: A graph of particulate pollution (PM ... 

 Key Quotes:  

“What is the mortality burden of air pollution on the local population?..The mortality burden is the effect on mortality attributable to air pollution at current levels; the statement considers the estimation of the mortality effects, in a given year, of long-term exposure to current levels of particulate pollution within the existing local population”

 “air pollution also affects morbidity and that air pollution-related illness is an additional burden on the population”

 “mortality of short-term exposure to other pollutants (e.g. ozone) ..understood to be much smaller than the mortality burden of long-term exposure to fine particles"

 “We have recommended methods for use in estimating the local mortality burden of long-term exposure to particulate air pollution (as PM2.5)…these recommendations strike an appropriate balance between the simplicity of undertaking the calculations (both in terms of applying the method and the ease of access to the data required) and the likely accuracy of the resulting estimates” 

“We suggest that the production of estimates of local burden for the whole of the UK at Local Authority level may be a cost-effective approach to this area of work”

 “the modelling of PM2.5 levels used to calculate the UK’s mortality burden was based on data collected at urban and rural background, but not roadside, monitors across the UK in 2008”
Enhanced by Zemanta

Wednesday, August 22, 2012

What is the Future of Air Pollution Globally?

Effects of business-as-usual anthropogenic emissions on air quality(23 page pdf, A. Pozzer, P. Zimmermann, U.M. Doering, J. van Aardenne, H. Tost, F. Dentener, G. Janssens-Maenhout and J. Lelieveld, Journal of Atmospheric Chemistry and Physics, Aug. 1, 2012)

Also discussed here: Air Pollution Worsening Worldwide: Cut Emissions Further, Experts Urge(ScienceDaily, Jul. 31, 2012)

Today we review a paper that looks at the state of air quality globally for the next 40 years, using an index that represents the five major pollutants and a global circulation model to produce scenarios into the future if we continue with “business as usual” policies. These scenarios show that countries and large cities with the worst widespread pollution (in Indo-Asia, the Middle East and North Africa) will not surprisingly deteriorate. The rest of the world’s state of pollution will worsen on average to what we see today in East Asia with the negative health results and enhanced anthropogenic climate change that this implies. Clearly improved atmospheric environmental policy is called for in almost all countries.  

Key Quotes:

“The analysis now published is the first to include all five major air pollutants know to negatively impact human health: PM2.5, nitrogen dioxide, sulphur dioxide, ozone, and carbon monoxide”

 “Air quality is a major issue in megacities worldwide (i.e. population centres with more than 10 million inhabitants), which are increasing in size and number…Megacities are strong localized pollution sources, .. their effects can extend over large distances of more than 1000 km downwind”

”At present, urban outdoor air pollution causes 1.3 million estimated deaths per year worldwide”

 “eastern China, northern India, the Middle East, and North Africa are projected to have the world's poorest air quality in the future”

 “it is projected that air quality for the global average citizen in 2050 would be almost comparable to that for the average citizen in East Asia in the year 2005”

 "Strong actions and further effective legislation are essential to avoid the drastic deterioration of air quality, which can have severe effects on human health,"

"We show that further legislation to control and reduce human-made emissions is needed, in particular for eastern China and northern India, to avoid hot-spots of elevated air pollution"
Enhanced by Zemanta

Monday, August 20, 2012

Health Impacts of Air Pollution in New Zealand

Updated Health and Air Pollution in New Zealand Study - Volume 2: Technical Reports (86 page pdf, Gerda Kuschel and Jayne Metcalfe, Emily Wilton, Jagadish Guria, Simon Hales, Kevin Rolfe, Alistair
  Woodward, HAPINZ, March 2012)


And here: Pollution harming Aucklanders' health - report (Trevor Quinn, Auckland Now, Jul. 31, 2012) 

And here: Air Quality (Auckland Council)

From New Zealand comes an updated report on the health impacts of air pollution based on an expanded monitoring of air pollution sources both natural and man made. The impacts are consistent with those in other developed countries where, for example, the number of premature deaths for Canada’s capital region, (Ottawa and Gatineau), with a population of just over 1.3 million and 530 deaths per year (reference: Illness Costs of Air Pollution for Ontario, 2008) compared to New Zealand’s capital, Auckland, with population of 1.4 million and 436 deaths, with over half coming from motor vehicle emissions. The report also flags impacts on children, specifically during the neonatal period. 

AIR POLLUTION CONTROL CENTER - NARA - 542766


 Key Quotes: 

 “The Health and Air Pollution in New Zealand study… show that man-made air pollution is associated with over 1,100 cases of premature mortality..Other illness associated with man-made emissions include:
  • 607 extra hospital admissions for respiratory and cardiac illnesses
  • 1.49 million restricted activity days (days on which people cannot do the things they might otherwise have done if air pollution was not present)”
“Auckland:
  • 436 premature deaths due to air pollution per year, with 58% of these (253) are due to motor vehicle emissions
  • asthma is the fourth highest cause of hospitalisation in the region
  • the Auckland region has one of the highest asthma rates in the world, with: - 12% to 23% of adults are asthmatic - 25% of children are asthmatic”
“The total social costs of air pollution from man-made sources in New Zealand (from both premature death and adverse health impacts) are estimated to be $4.28 billion per year or $1,061 per person”

 “the estimated relative contributions would have been 42 per cent natural sources, 13 per cent domestic heating and 35 per cent motor vehicles”

“The main natural sources of PM10 in New Zealand are sea spray (referred to as ‘marine aerosol’) and windblown dusts (referred to as ‘soil’)…In winter, domestic heating was found to be the main source of PM10. “

“the strongest evidence for effects on mortality in children relates to the post neonatal period (ages 1 month to 1 year…This is a potentially important category of health effect which does not overlap with the assessment of mortality in adults”

 “There is evidence that both proximity to busy roads and NO2 exposure have important health effects, especially on respiratory symptoms and lung development in children”
Enhanced by Zemanta