Thursday, January 29, 2015

What does it take for Electric Vehicles to Take-off?

Policy Incentives for the Adoption of Electric Vehicles across Countries (23 page pdf, Xingping Zhang, Jian Xie, Rao Rao and Yanni Liang, Sustainability, Nov. 14, 2014)

Today we review a paper that summarizes the growth of Electric Vehicles (EVs) world-wide and the policies used (or those which could be used) in various countries to encourage adoption by the public and weaning off the use of Internal Combustion Engines (ICEs) which produce so much of the pollution and CO2 emissions seen in major cities today. The key ingredients se to be a combination of financial incentives both for development funds and purchase of the new technology and in its use (such as free travel in HOT lanes) and the development of an charging station infrastructure to a level that makes charging less of an (suggested one station per 100,000 residents).

 ev use in countries  
 Key Quotes:

“The widespread use of EVs is not only helpful for CO2 emissions reduction in the transport sector, but also conducive to adjusting the energy structure through increasing the proportion of non-fossil fuel energy. Therefore, many countries regard EVs as their strategic emerging industries and set their targets to promote the large-scale adoption of EVs”

 “Many countries are ambitious in wanting to achieve more than one million EVs on the road before 2020, according to Table 1. The United States plans to achieve the goal of one million EVs early in 2015. Though China intends to reach only 0.5 million EVs in 2015, it is going to realize the goal of five million EVs by 2020…the EVs on the road will reach nearly 20 million around the world by 2020”

“Although EVs can mitigate air pollution compared to ICE [internal combustion engine] vehicles, it is still difficult for consumers to accept EVs; because they are not willing to pay for social benefits that would not directly benefit themselves in the short time”

Tuesday, January 27, 2015

Modelling the Dynamics of Traffic Congestion and Urban Air Pollution Hot Spots

MIT Study devises new algorithm to predict traffic patterns (Becca DeGregorio, The Daily Free Press, Nov. 13, 2014)

Also discussed here: Understanding Road Usage Patterns in Urban Areas (6 page pdf, Pu Wang, Timothy Hunter, Alexandre M. Bayen, Katja Schechtner & Marta C. Gonzalez, Scientific Reports, Nature, Dec. 20, 2012)

And here: Phone data helps pinpoint source of traffic congestion (On Balance, Dept. Civil and Environmental Engineering, Massachusetts Institute of Technology, Jan. 2013)

And here: http://www.youtube.com/watch?v=9YDqVBUO3Ps (48 sec You-Tube, Marta Gonzalez, Dec. 8, 2013)

And here: Gridlock Traced to Just a Few Key Commuters (Rocket News, Dec. 21, 2012)

Today we review research from MIT aimed at diagnosing the dynamics of traffic congestion using mobile phone records and population and origin-destination statistics to identify key congested road segments that lead to major congestion across major cities such as San Francisco and Boston. These congested areas rapidly lead to high levels of pollution that affect the entire urban area which puts both drivers and others such as cyclists who use the roads at risk to their health. Better design of the road network and method to reduce traffic peaks such as congestion pricing are offered as solutions.


traffic congestion    

Key Quotes:

 “In 2007 alone, congestion forced Americans living in urban areas to travel 4.2 billion hours more, purchase an additional 2.8 billion gallons of fuel, at a total cost of $87.2 billion”

 “the major usage of each road segment can be traced to its own – surprisingly few - driver sources…in contrast to traditional approaches, which define road importance solely by topological measures, the role of a road segment depends on both: its betweeness and its degree in the road usage network”

“For a road segment, its level of congestion can be measured by the additional travel time te, defined as the difference between the actual travel time ta and the free flow travel time tf. The drivers who travel through congested roads experience a significant amount of te.”

 “the major traffic flows in congested roads are generated by very few driver sources, which enables us to target the small number of driver sources affected by this significantly larger Te.”

Congestion hot spots can become air quality hot spots within a short amount of time…If you as an individual are stuck in a car and you’re driving in traffic, you’re spending more time being exposed to potentially higher levels of air pollution. The same thing goes for bikers and pedestrians along that roadway.”

 “Ultrafine particles and combusted pollutants from gasoline and diesel fuel are the road’s most common threats to air quality... In urban areas, such as Boston, motor vehicles contribute a large percentage of both.”

“the team could model their algorithm, which aims to prevent inconveniences and environmental stressors triggered by the onset of traffic, based on human destination sites.These sites within the traffic flow prediction formula were then categorized into “absorbers” and “emitters,” with absorbers marking daily locations that draw in large numbers of people — like BU, for example — and emitters marking the places where people live”

Thursday, January 22, 2015

How Liable are UN Member States for Inaction on Climate Change?

Greenhouse gas emissions per capita in 2000 wi...
Greenhouse gas emissions per capita in 2000 without land-use change Data from the World Resources Institute's CAIT 4.0 database (registration required). Includes CO2, CH4, N20, PFCs, HFCs and SF6. Neither land-use change nor bunker-fuel emissions is included. (Photo credit: Wikipedia)
The Liability of European States for Climate Change (11 page pdf, R. H. J. Cox, Journal of Planning & Environment Law, Jun. 9. 2014) Also discussed here: Revolution Justified (328 pgs, Roger H.J.Cox, Amazon paperback, Nov. 14, 2012) 

 Today we review a scholarly article that examines the background behind a legal proceeding raised in November 2013 against the Netherlands for not taking action to avert dangerous climate change which was agreed on through international agreements to reduce GHG emissions by at least 25% from 1990 levels by 2020. The current Dutch reduction target is 16% by 2020. The suit makes use of the findings of the IPCC which are recognized by 195 member states which because of the worldwide process used to produce them carry “exceptional evidentiary weight in legal proceedings”.

Key Quotes: 

 “Can individual European states be held liable for their contributions to this global issue? Dutch attorney Roger Cox thinks they can and wrote the book Revolution Justified to explain why. His book provided the impetus for the first climate proceedings against a European member state: the Netherlands” 

 “the state is acting unlawfully with respect to them and their collective interests if it fails to achieve a 40 per cent or in any case 25 per cent (minimum) reduction in the level of greenhouse gas emissions in the Netherlands by the year 2020 relative to the level in 1990.” 

"The findings of the IPCC are recognised by the 195 countries (and the European Union) that signed the 1992 UN Climate Convention and have been adopted (also by the Netherlands) as the premise for their climate policies. As such, these findings carry exceptional evidentiary weight in legal proceedings, particularly as the IPCC’s reports are compiled through a worldwide process of hearing all arguments,” 

 “It is a known fact that the Netherlands is not striving (nor, indeed, is the European Union) to achieve a 25–40 per cent reduction by 2020 relative to 1990. Under current government policy, the reduction target for 2020 has been fixed at 16 per cent. This means the Netherlands will not be meeting the basic condition that it previously acknowledged as essential for achieving the climate target to avert dangerous climate change.” 

“According to the UN Human Rights Council (Resolution 10/4 of 2009), the danger attending climate change, and especially a climatic change of more than two degrees, poses a threat to human rights around the world, most notably to the right to life and the right to health.”

Tuesday, January 20, 2015

How Does Stress Combine with Air Pollution to Affect Health Impacts?

English: Air pollution
English: Air pollution (Photo credit: Wikipedia)
Social stressors and air pollution across New York City communities: a spatial approach for assessing correlations among multiple exposures (25 page pdf, Jessie LC Shmool, Laura D Kubzansky, Ogonnaya Dotson Newman, John Spengler, Peggy Shepard and Jane E Clougherty, Environmental Health, Nov. 6, 2014)

Today we review research into the association, if any, between between social environment stresses and air pollution as they both affect health outcomes in a large city (New York) in the assumption that stress may weaken the body’s reaction to air pollution . The stresses range from murder rates to Food Bank registrations. Results indicate that linking a single stress proxy to air pollution may not produce reliable conclusions for environmental health policy– rather the authors recommend both more research and the use of multiple stress measures.

Key Quotes:

“Chronic psychosocial stress is associated with negative emotional states and maladaptive behaviors that influence immune, endocrine, and metabolic function to produce cumulative wear-and-tear – often referred to as allostatic load [16]. These physiologic changes may alter individuals’ reactivity to chemical exposures (e.g., pathogens, pollutants) and increase risk for multiple disease etiologies”

"using any single stressor (including SEP) measure to serve as a proxy for psychosocial stress may be misleading; because areas that may be similar with respect to area-level SEP measures may differ regarding social stressors, single measures may inadvertently lead to confounding, and fail to capture important nuances of the social environment.”

"air pollution was strongly correlated only with the spatial factor corresponding to ‘Noise complaints and property crime’ (Factor 3), not with the other factors, or with indicators of area-level SEP.”

"Our findings demonstrate that selection of social stressors and geographic scale may substantially alter observed effect modification, caution against using single SEP indicators as proxies for social stressors, and demonstrate the risks associated with mis-specification of social stressor exposures.”

Thursday, January 15, 2015

Did Congestion Charges Affect Traffic Accidents in London?

Congestion Traffic Accidents and the London Charge (Colin P. Green, John. S. Heywood and Maria Navarro, Economics Working Paper Series 2014/015, Lancaster University Management School, Nov. 3, 2014)

 Also discussed here: London’s congestion charge increases speed and saves lives (Colin Green, The Conversation, Nov. 3, 2014)

Today we review research into the link, if any, between London’s Congestion Charge Zone (CCZ) introduced in 2003 and the number of traffic accidents in and around the zone. The CCZ has been successful in reducing the volume of vehicles entering the CCZ and increasing their speed, as a result of less congestion and increasing the number of public transit buses and bicycles. One might have expected accidents with cyclists and pedestrians to spike. However, research shows that accidents are down by 40% which translates into 45 fewer cases of serious accidents or death. Each increase of the congestion charge by a pound has decreased the number of accidents by 5 per month- and the effect also applies in surrounding areas and during times when there is no charge within the CCZ. As one commentator to the article pointed out, the impact may not be simply economics and that some credit may be due to the improved safety plan for the CCZ which included improved signaling and the simple fact that fewer cars means fewer accidents. The results indicate an unexpected benefit of congestion charging beyond improved air quality, more reliable travel and revenue for improved transit. conjestion charge less accidents

 Key Quotes:

“Traffic accidents and related injuries and fatalities weren’t the main target of the congestion charge, but they may have been influenced by it”

“The congestion charge reduced traffic accidents in central London by 30 a month – an enormous 40% reduction. Accidents that result in individuals being killed or seriously injured also fell, by just under four a month, or 45 a year. This means around 500 people have avoided serious injury or death thanks to the congestion charge.”

“Did the congestion zone just move traffic to other parts of London, other times of the day, or to non-charged vehicles?... The charge decreased accidents dramatically in the surrounding areas – about 20 fewer total accidents a month, with 3.5 fewer serious or fatal accidents. Our estimates also show that accidents and injuries were reduced in non-charged times (before 7 am and after 6 pm) and for exempt vehicles (largely bicycles, motorcycles, taxis and buses).”

"Is the congestion charge set at the right level?.. Since the initial £5 charge in 2003, it has been raised twice, £8 in 2005 and £10 in 2011…each pound increase in levy reduces accidents by 5 per month”

 “Implementing the Congestion Charge scheme involved a lot of junction redesign, improved signalling for all road users, roadspace reallocation away from cars; enforcement of bus lanes and other traffic regulations it was a comprehensive intervention, and also took place alongside, and closely co-operated with, delivery of a comprehensive safety plan.”

“While we have focused on only one benefit from the charge, accident reduction, other benefits include increased speed, travel reliability and reduced air pollution.”

Tuesday, January 13, 2015

When are You Too Old to Drive?

Is the U.S. Ready for Seniors Who Want to Stop Driving? (Angie Schmitt,Streetsblog, Oct. 27, 2014)

Also discussed here: When Planning for Retirement, Consider Transportation (Harriet Edleson, New York Times, Oct. 17, 2014)

And here: What About The Elderly? (Andrew Price, Strong Towns, Oct. 17, 2013)

And here: Driving Life Expectancy of Persons Aged 70 Years and Older in the United States (6 page pdf, Daniel J. Foley, Harley K. Heimovitz, Jack M. Guralnik and Dwight B. Brock, American Journal of Public Health, Aug. 2002)

Today we review several articles that look at the older generation (getting bigger) and how much they drive (a little less) and how big a challenge it is for them to get around (bigger). One downside is that older drivers are three times more likely to die in a car accident because of their reduced ability to drive, offset by the number who chose not to drive anymore. Some prefer to live in communities where one can walk to get what one needs, even though walking for some is as challenging as driving. Are city planners taking into account the growth of the older population and their differing needs for transportation? As one commentator noted “We cannot ignore the problem, because we will all be elderly one day.”


driving ages  

Key Quotes:

‘The health and longevity of the elderly population in the United States are at unprecedented levels, and many older persons continue to drive throughout their eighth and ninth decades of life… Overall, 82% of the men aged 70 years or older were driving, compared with only 55% of the women.”

“Compared with middle-aged drivers, older drivers have about a 3-fold increased risk of crashing per mile driven. However, older persons drive markedly fewer miles annually than middle-aged drivers, resulting in an equivalent annualized risk for crashing. ”

“Compared with middle-aged drivers of the same sex and involved in the same severity of crash, older drivers are 3 times more likely to die as a result of the crash.. Overall, the mortality rate among male drivers (89 deaths per 1000 drivers) was 62% higher than that among female drivers (55 deaths per 1000 drivers).”

“Americans are outliving their ability to drive safely — a woman, on average, by 10 years, a man by seven.”

“When people make retirement plans, they make no transportation plans because they assume they’re going to drive forever,”

“Nationally, for those over 65, 2 to 3 percent of what distance they travel is on public transportation, 8 percent on foot and the rest by car”

“getting from public transportation to your final destination or walking a mile or more to a bus stop could present an insurmountable challenge, especially on freezing winter days or hot, muggy stretches”

“Those living in households that are car-dependent spend 25 percent of income on transportation. By living closer to work, shopping, restaurants and other amenities, households can reduce transportation costs to 9 percent of their total income.”

“Walkability and access to mass transit are essential factors in housing choice (increasingly for millennials as well as seniors!) and should be considered in any planned development.”

“The majority of Post-World War 2 suburban development has been oriented around the automobile. From the large suburban plots, to the hierarchical street system, to the strip malls and big box stores - they have all been designed with the assumption that everyone drives…. Because nobody walks, there is no real incentive for developers to build sidewalks.”

Thursday, January 8, 2015

If Carbon Pricing Comes, What will Lead Up to it?- a “Future History”

The Sudden Rise of Carbon Taxes, 2010–2030 (37 page pdf, Lawrence MacDonald and Jing Cao, Center for Global Development, Oct. 20, 2014)   

Today we review a “future history” that begins by assuming that by 2030 the world will not only have accepted but embraced carbon pricing. The authors predict what changes would be needed to get there with emphasis on what the two biggest CO2 emitting nations, the USA and China, do and why they do it (different reasons). Key aspects are the socio-economic benefits that accrue after carbon taxes are implemented, the penalties that arise (such as legal liabilities for climate impacts) when the main players are slow to respond and the role played by the British Columbian government in Canada in enacting a province-wide carbon tax on consumers which was both successful and popularly supported and served as a  model for other jurisdictions

English: U.S. Energy Flow Chart of 2008 Estima...
English: U.S. Energy Flow Chart of 2008 Estimated U.S. Energy Use in 2008 is ~99.2 quads (Photo credit: Wikipedia)

Key Quotes:

“It’s 2030 and instead of racing toward the brink of climate catastrophe the world has begun to back away. …although carbon dioxide (CO2) concentrations in the atmosphere breached 450 parts per million (ppm) last year—the level believed to offer a 50 percent chance of holding global warming below 2 degrees Centigrade this century—the rate of increase has slowed dramatically.”

“countries need not wait on internationally coordinated efforts if some carbon mitigation is in their own national interests—that is, the domestic environmental benefits exceed the CO2 mitigation costs, leaving aside climate benefits.”

Benefits of carbon pricing:
• “Fiscal advantages. Revenue from pricing carbon, whether generated from a tax or from the auction of tradable permits, has made it possible to roll back and even eliminate other, more distorting taxes….
• A wealth-creating green industrial revolution . [7] Countries that moved early to price emissions experienced a surge of investment into climate-friendly technologies: hyper energy efficiency, cheap clean renewables, energy-saving nanotechnologies, and green biotech. …
• Better health, reduced pollution. Reductions in noncarbon local and regional pollution, especially from coal (ultrafine particle pollution known as PM2.5, sulfur dioxide, carbon monoxide, mercury, lead, zinc, cadmium, and soot) but also from oil and natural gas, have cut cancers and cardiovascular and respiratory diseases around the world…”

“The company [Exxon Mobil] also suffered a major blow in the early 2020s when it lost a multi-trillion-dollar class action suit brought by an alliance of US state attorneys general, displaced residents of submerged island states, and environmental groups seeking damages in connection with the firm’s support for climate denial junk science.”

“US interest in carbon pollution taxes was also boosted by slowly growing awareness of the success of a carbon tax implemented in the western Canadian province of British Columbia starting in 2008. A 2013 assessment of the tax … found that the province’s consumption of fossil fuels covered by the tax fell 19 percent per capita compared with the rest of the country, while the province’s economy outperformed most of Canada…polls in British Columbia showed that public support for the provincial carbon tax increased during the first four years of implementation, to 64 percent.”

“In 2015 China imposed a 10 yuan per ton tax on carbon emissions, with the proceeds split evenly between the central government and the provinces. Collections were made upstream, at the extraction points for coal and oil (mine mouths and wellheads) and at the port of entry for imports of coal, oil, and natural gas….Today China has carbon taxes of 50 yuan per ton”

Responses to higher energy prices:
• “ were changes in household and firm behavior, activities such as insulating homes and commercial and industrial structures, switching to lower-energy lighting fixtures, taking fewer and shorter car trips, and making greater use of public transport.”
• increased investment in new technology for energy production, distribution, and use…”
• the surge of investment into carbon capture and storage (CCS) technologies for retrofitting existing coal- and oil-burning power plants.”

Tuesday, January 6, 2015

A Plan to Reduce CO2 Emissions from USA by 40% by 2035

English: Worldwide Renewable energy, existing ...
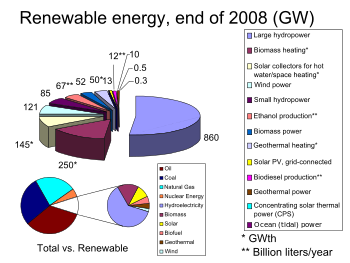
English: Worldwide Renewable energy, existing capacities, at end of 2008, from REN21.http://www.ren21.net/globalstatusreport/g2009.asp Total energy is from BP Statistical Review.http://www.bp.com/statisticalreview (Photo credit: Wikipedia)
Green Growth - A U.S. Program for Controlling Climate Change and Expanding Job Opportunities (417 page pdf, Robert Pollin, Heidi Garrett-Peltier, James Heintz, and Bracken Hendricks, Center for American Progress, Sep. 2014)

 Also discussed here: The Need for Jobs, and the Ecological Limits to Growth (Jeffrey M Doyle, Oct. 17, 2014)  

Today we review a realistic short term plan for the USA that would comply with the IFCC objective to reduce world-wide greenhouse gas emissions by 40% from 2005 levels before 2035. It is based on making reductions in consumption of coal, oil, natural gas by 30-60% while assuming that the cost of renewable energy (hydro, wind, geothermal) will continue to decrease to the same levels as for carbon fuels by 2017. A carbon tax that would discourage carbon fuel use can produce public revenues of $ 200 B/year while avoiding economic impacts of $150 B/year if a 3 degree increase in earth temperature cannot be averted.

Key Quotes:  

“The question for policymakers, and all other citizens, is no longer whether humans are changing our climate. The question now is, how we can stabilize an already changing climate in a way that promotes economic prosperity?”  

"If a successful carbon tax or cap were implemented as part of this plan, it would also yield public revenues averaging $200 billion per year…if we were to assume that 75 percent of the revenues from a carbon cap or tax were returned directly to taxpayers, this would still leave roughly $50 billion per year to channel into supporting clean energy investments.  

“A recent White House Council of Economic Advisors report found that a temperature increase of 3 degrees Celsius above pre-industrial levels would increase economic damages by $150 billion, year after year in perpetuity. “  

 “as of 2012 roughly 80 percent of all renewable energy consumed in the United States came from either bioenergy or hydro power…the average cost for producing electricity from most clean renewable sources—including wind, hydro, geothermal, and clean bioenergy—will be at rough cost parity with most nonrenewable sources by 2017”  

“Some things should grow a lot, like the clean energy sector. Other things should shrink, like the fossil fuel sector. The growth from massive investments in clean energy will lead to millions of jobs.”  

“To meet the 20-year emissions-reduction target, the following energy and eco­nomic policies are required:  
  • Reductions in fossil fuel consumption by approximately 60 percent for coal, 40 percent for oil, and 30 percent for natural gas
  • Reduction of overall U.S. energy consumption by approximately 30 percent relative to current levels
  • Raising overall U.S. energy production from low to zero emissions renewables by more than fourfold.
  • Reduction in oil imports to absorb most of the decline in U.S. oil consumption…
  • Transitional support”
  • No expansion of nuclear energy supply”