Tuesday, May 31, 2016

What is the Social Cost of Climate Change?

Expert Consensus on the Economics of Climate Change (41 page pdf, Peter Howard and Derek Sylvan, Institute for Policy Integrity, New York University School of Law, Dec. 2015)

 Today we review a survey of 365 leading economists from around the world on the economic and social impacts of climate change and how they expect this cost will grow in the future. Most believed that there will net negative global impacts by 2025, hitting agriculture, fishing, utilities (electricity, water, sanitation), forestry, tourism/outdoor recreation, insurance, and health services. The social cost was projected to start at $100/metric ton in 2015, rising to above $300/ton in 2050 and this cost was suggested as a basis for carbon pricing to reduce emissions which most thought should be above $37/ton to start. Currently in Canada, the highest price put on carbon is in British Columbia at $30/ton (and frozen at that level for the last 3 years) with some provinces (Quebec, Ontario, Alberta) setting it between $10 and 15/ton, leaving others with no price (Saskatchewan, Manitoba and the Atlantic provinces).

  social cost by year from cl ch  

Key Quotes:

Some key findings:
  • “experts believe that climate change will begin to have a net negative impact on the global economy very soon – the median estimate was by 2025”
  • ”A majority predicted negative impacts on agriculture (94%), fishing (78%), utilities (electricity, water, sanitation – 74%), forestry (73%), tourism/outdoor recreation (72%), insurance (66%), and health services (54%)”
  • ”three-quarters of respondents believe that climate change will have a long-term, negative impact on the growth rate of the global economy”

Thursday, May 26, 2016

How Much do Computers Contribute to Climate Warming?

The bitcoin logo
The bitcoin logo (Photo credit: Wikipedia)
The dirty parts of the computing world (Nathan Ensmenger, Bulletin of the Atomic Scientists, Apr. 11, 2016)

 Today we review as assessment of the degree to which computers and computer networks contribute to or pollute with energy use, water consumption, mining and e-waste. In all four categories computer technology plays a significant role with 2 of global electricity use, and 25 tons of e-waste from Western countries alone. A typical desktop computer uses 30% more energy than the standard refrigerator. The computational output from Bitcoin is 256 times the combined capacity of the world’s 500 top supercomputers. In many countries, energy is produced from fuels such as coal and natural gas which produce carbon emissions. Clearly computers should be part of the accounting of the world’s energy, waste and water tallies.  

Key Quotes:

“Places such as Google, Amazon, Netflix, and Microsoft have facilities much larger than CERN’s, which they use for taking on even bigger volumes of high-throughput computing jobs.. Data centers contain the machines that do the actual work behind such activities as shopping online, booking the world’s hotel and automobile reservations, transmitting movies down fiber optic lines, emailing, storing photos, putting up people’s billions of Facebook posts”

“It seems that much of our shiny, white, iPad economy—promoted so heavily as environmentally friendly—actually runs on dirty black coal.”  

four aspects of the online economy:
  1. energy use -” data centers alone account for almost 2 percent of all global electricity use, and this use is projected to increase by at least 12 percent annually.. if the Cloud were a country, it would rank sixth overall in national energy consumption, behind the United States, China, Russia, India, and Japan—but well ahead of Germany, Canada, Brazil, and France” 'The energy burden of a desktop computer, for example, is 1.3 times that of a refrigerator. The total amount of fossil fuels used to make one desktop computer weighs over 240 kilograms, or about 520 pounds" 
  2.  water consumption “Cooling even a medium-size high-density server farm can require as much as 360,000 gallons of water (1,362,748 liters) per day.” 
  3. mining of the materials needed for the global digital economy. “Many of the rare earth elements crucial to both high-tech mobile devices and renewable energy technologies are controlled almost entirely by China, and are found only as by-products of traditional extractive industries.  
  4. e-waste “Western nations alone account for more than 25 million tons of e-waste every year, and the disposal of this waste—often in less environmentally regulated regions of the developing world—introduces into the environment such dangerous contaminants as lead, antimony, mercury, cadmium, and nickel, as well as polybrominated diphenyl ethers and polychlorinated biphenyls (PCBs)” “Bitcoin’s worldwide computational output is closing on on 200 exaflops—or, to put it another way, 256 times the combined capacity of the world’s top 500 supercomputers,”

Tuesday, May 24, 2016

When Will the Corner Gas Station Disappear?

End Of Gas Stations III: Coming To A Corner Near You (Walker Angell , Streets.mn, Apr.8, 2016)

Today we review a forward looking article that predicts, on the basis of recent sales of electric vehicles and longer range because of battery technology improvements, that this may well be the last decade that we see, let alone buy an internal combustion engine vehicle. Several car manufacturers are already planning on major increased production of BEVs [battery electric vehicles] by 2020 and the market share of these vehicles has been increasing by 60% per year in recent years. Further, as battery efficiency continues fewer people will buy hybrid cars, preferring to jump to all electric with greater ranges. On the horizon this will have a major and positive impact on urban air quality.

 gas station  

Key Quotes:

 “Tesla expects to be producing 500,000 battery electric vehicles (BEVs) per year by 2020.. Volvo expects 10% of their global sales in 2020 to be BEVs and much of the rest to be plug-in hybrid vehicles (PHEVs)”

“Worldwide PEV[all plug-in EVs] market share has increased by over 60% each of the past 3 years and this is expected to continue.”

 “Battery costs per kWh are falling about 35% each year and the electric range of all PEVs is increasing”

“Those who have ever driven electrically are lost for the internal combustion engine for all time.” Bloomberg are predicting that there could be an oil crisis by 2023, compliments of increasing numbers of PEVs reducing gas consumption, leading to the bottom falling out of the oil markets”

“the average car lasts about 11.4 years, so it will take some time to replace all of them (and 15- to 20-year-old cars aren’t unusual).”

“The vacating of gas stations and other ICE[internal combustion engine] -specific services will be one more element, and a major one, in the reshaping of land and space use that will happen in our communities over the next few years.”

Thursday, May 19, 2016

Modelling the Best Way to Reduce Global Carbon Emissions

English: Carbon flow schematic of different en...
English: Carbon flow schematic of different energy source, including systems with carbon capture and storage (Photo credit: Wikipedia)
2 °C and SDGs: united they stand, divided they fall? (16 page pdf, Christoph von Stechow, Jan C Minx, Keywan Riahi, Jessica Jewell, David L McCollum, Max W Callaghan, Christoph Bertram, Gunnar Luderer and Giovanni Baiocchi, Environmental Research Letters, Mar. 16, 2016)

Also discussed here: Short-sighted climate policy jeopardizes other UN sustainable development goals (International Institute for Applied Systems Analysis News, Mar. 16, 2016)

 Today we review the results from 7 “integrated” models which were used to assess 20 scenarios for each decade out to 2050 while considering the 17 Sustainable Development Goals (SDGs) and 169 targets and the agreement to limit global climate warming to 2 deg C, set out in the recent COP 21 conference in Paris. Some carbon emission reduction strategies have emphasized economic impacts alone, failing to take into account wider social and environmental implications.

Application of carbon pricing to transportation, for example, has a greater potential for lowering emissions in the near term because of the short turn-around needed for technological improvements (e.g. electric vehicles) and the quick responsiveness of users to fuel price changes. On the other hand, a major increase in energy prices can have major impacts on the poor in developing countries, unless their concerns are accommodated in some way.

Another significant finding from this research is the impact of delaying the reduction of energy while waiting for potential non carbon energy technologies to become cost effective and widely used, such as BioEnergy(BE), Carbon Capture and Storage (CCS) and Low Energy Nuclear Reaction (LENR). The modelling indicates that delaying climate mitigation in the short term, to give time for these technologies to emerge, leads to more risk and costs in the long term if the 2 deg goal is to be met. 
 

 Key Quotes:

“some 2 °C pathways could, if not designed properly, undermine SD in non-climate dimensions. For example, pathways with a limited short-term ambition like the current INDCs may have higher SD risks than more ambitious ones…Such broader SD implications could delegitimize some 2 °C pathways or even the 2 °C target itself”

“Since the transport sector is characterized by faster capital turnover rates (at least with regard to the vehicle fleet) .. it can react more quickly to carbon price changes, compensating for higher emissions from sectors that are less flexible.”

“a 20%–30% increase in energy prices may have a much more immediate, adverse effect on the poor in many countries than a 4-7-fold increase in maximum decadal upscaling of variable renewable energy sources, which is primarily a technological and institutional challenge for infrastructure provision.”

“delaying stringent mitigation in the near term leads to a significant increase in mitigation risk levels in the medium term compared to optimal 2 °C pathways. With more GHG emissions before 2030, subsequent reductions are more expensive”

 “assuming lower energy demand growth entails mitigation risk reductions relative to optimal 2 °C pathways ..As each unit of energy not produced is free of pervasive supply-side risks, reducing energy demand by promoting energy efficiency in end-use sectors,… lifestyle changes .. and structural changes in the economy …is an important strategy both for mitigation and other sustainable energy objectives"

 “the absence of CCS seriously questions the achievability of the 2 °C target in a world with delayed climate action and therefore threatens the climate SDG itself” “SD considerations are central for determining socially acceptable climate policies and that the prospects of meeting other SDGs need not dwindle and can even be enhanced for some goals if appropriate climate policy choices are made.”

“limiting the availability of key mitigation technologies yields some co-benefits and decreases risks specific to these technologies but greatly increases many others”

Tuesday, May 17, 2016

How is Air Pollution Linked to Diabetes and Insulin Sensitivity?

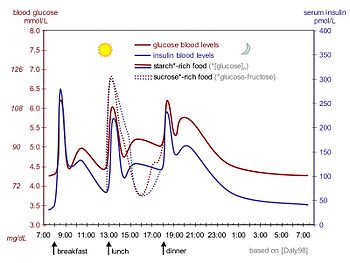
English: idealized curves of human blood gluco...
English: idealized curves of human blood glucose and insulin concentrations during the course of a day containing three meals; in addition, effect of sugar-rich meal is highlighted; (Photo credit: Wikipedia)
Ambient Air Pollutants Have Adverse Effects on Insulin and Glucose Homeostasis in Mexican Americans (Abstract, Zhanghua Chen, Muhammad T. Salam, Claudia Toledo-Corral, Richard M. Watanabe, Anny H. Xiang, Thomas A. Buchanan, Rima Habre, Theresa M. Bastain, Fred Lurmann, John P. Wilson, Enrique Trigo and Frank D. Gilliland, Diabetes Care, Mar.29, 2016)

Today we review research conducted in Mexico that examined the links between air pollution and insulin sensitivity. Results indicated that short term (under 2 months) exposure to fine particulates (PM2.5) was linked to lower insulin sensitivity and higher cholesterol and this effect was highest with obese patients.  


 Key Quotes:

“Ambient air pollutant concentrations (NO2, O3, and PM2.5) for short- and long-term periods were assigned by spatial interpolation (maximum interpolation radius of 50 km) of data from air quality monitors. Traffic-related air pollution from freeways (TRAP) was estimated using the dispersion model as NOx”  

Short-term (up to 58 days cumulative lagged averages) exposure to PM2.5 was associated with lower insulin sensitivity and HDL-to-LDL cholesterol ratio and higher fasting glucose and insulin, HOMA-IR, total cholesterol, and LDL cholesterol (LDL-C)”

“The effects of short-term PM2.5 exposure on insulin sensitivity were largest among obese participants.” “Exposure to ambient air pollutants adversely affects glucose tolerance, insulin sensitivity, and blood lipid concentrations.”

Thursday, May 12, 2016

The Anthropocene and the Future

The Anthropocene: a conspicuous stratigraphical signal of anthropogenic changes in production and consumption across the biosphere (20 page pdf, MarkWilliams, Jan Zalasiewicz, Colin N.Waters, Matt Edgeworth, Carys Bennett, Anthony D.Barnosky, Erle C. Ellis, Michael A. Ellis, Alejandro Cearreta, Peter K. Haff, Juliana A. Ivar do Sul, Reinhold Leinfelder, John R. McNeill, Eric Odada, Naomi Oreskes, Andrew Revkin, Daniel deB Richter,Will Steffen, Colin Summerhayes, James P. Syvitski, Davor Vidas, Michael Wagreich, Scott L.Wing, Alexander P.Wolfe, and An Zhisheng, AGU Publications - Earth’s Future, Mar. 14, 2016)

Also discussed here: Human impact forms 'striking new pattern' in Earth's global energy flow (ScienceDaily, Mar. 23, 2016)

Today we review a geophysical history of the earth from the days when carbon and biological life were not present, through the evolution of the biosphere over 4 Billion years and photosynthesis to the advent of animal and plant life some 460 million years ago, modern humans 195, 000 years ago to the farming of land 10,000 years ago and the build-up of carbon dioxide in the atmosphere and the beginning of a new geological epoch, the Anthropocene. This history not only puts the significance of global climate change into context but it also shows the ways that man has literally changed the world.

 anthrocene future  

Key Quotes:

  “The impact humans have made on Earth in terms of how we produce and consume resources has formed a 'striking new pattern' in the planet's global energy flow”

"Scale and process in the Earth’s biological-consumption system can be measured in a number of ways: a common one is Net Primary Production (NPP)—a measure of the net flux of carbon from the atmosphere into plants for a given time.”

 “Currently, humans appropriate between 25 and 38% of NPP [dependent on different estimates… they liberate considerable additional energy from fossil NPP [hydrocarbons such as coal, oil and gas;..and, increasingly, produce energy from sources such as hydropower, solar radiation, wind, waves, geothermal sources, and nuclear reactors.”

 “the team identified that human patterns of production and consumption are a key factor characterizing the epoch, and when measured against the billion-year old patterns of planet Earth, they form a striking new pattern.”

"Very big changes in our planet's pattern of biological production and consumption do not happen very often. The appearance of photosynthesis was one, about two and a half billion years ago. Then, a little over half a billion years ago, animals like trilobites appeared, to add scavengers and predators into a food web of increasing complexity.”

"It is without precedent to have a single species appropriating something like one quarter of the net primary biological production of the planet and to become effectively the top predator both on land and at sea."

“a biosphere state that is characterized by a geologically unprecedented pattern of global energy flow that is now pervasively influenced and mediated by humans, and which is necessary for maintaining the complexity of modern human societies.”

Tuesday, May 10, 2016

What is the Local Environmental Impact of Fracking?

Investigating the traffic-related environmental impacts of hydraulic-fracturing (fracking) operations (13 page pdf, Paul S. Goodman, Fabio Galatioto, Neil Thorpe, Anil K. Namdeo, Richard J. Davies, Roger N. Bird, Environment International, Feb. 1, 2016)

Today we review an aspect of fracking, not often investigated: the impact of local fracking wells which is a combination of the air pollution emissions from the fracking itself and the removal of waste water by tanker trucks which adds vehicle emissions and noise. There is a requirement for 9,000 to 29,000 cubic metres per well, or 54,000 to 174,000 cubic metres for a six-well pad. Total CO2 emissions associated with extraction of shale gas from a well were small (0.2–2.9%) compared to the combustion of the gas from the well. Modelling of NOx emissions showed increases reaching 30% over non-fracking periods and noise levels doubling.

  fracking traffic  

Key Quotes:

 “relatively high population densities in many countries and the potential negative environmental impacts that may be associated with fracking operations has stimulated …significant public debate regarding if and where fracking should be permitted. Road traffic generated by fracking operations is one possible source of environmental impact whose significance has, until now, been largely neglected in the available literature.”

“the local impacts of a single well pad may be short duration but large magnitude… whilst single digit percentile increases in emissions of CO2, NOx and PM are estimated for the period from start of construction to pad completion.. excess emissions of NOx on individual days of peak activity can reach 30% over baseline”

 “A production well pad could include 12 or more wells, which may be re-fracked several times, once production has declined. It subsequently becomes necessary to remove flowback water from those sites both during and after fracturing. If this transportation is done by road, as has typically been the case in the US and Canada, then considerable volumes of HDV (i.e. tanker) traffic may be generated, albeit for relatively short periods (i.e. weeks) of time. “

"The production of CO2 from traffic emissions due to shale gas exploitation has been previously examined …with on-road emissions estimated at 38 t–59 t CO2 per well… total CO2 emissions associated with extraction of shale gas from a well were small (0.2–2.9%) compared to total emissions from combustion of the gas produced by the well”

“each stage of a fracking operation for a single well will require between 1100 and 2200 m3 of water, leading to a total demand of 9000 to 29000 m3 per well, or 54,000 to 174,000 m3 for a six-well pad.”

“Total daily NOx emissions increase by 18%–20% (low scenario), and 27%–30% (high scenario) depending on access policy…the best policy for diurnal total emissions is overnight access, which creates negligible conflict with baseline traffic, though the relative emissions in the overnight period increase by a factor of 2–2.6.”

"Modelling of NOx emissions showed increases reaching 30% over non-fracking periods and noise levels doubling (+3.4 dBA), dependent on access policy implemented to the site, potentially exacerbating existing environmental issues.”